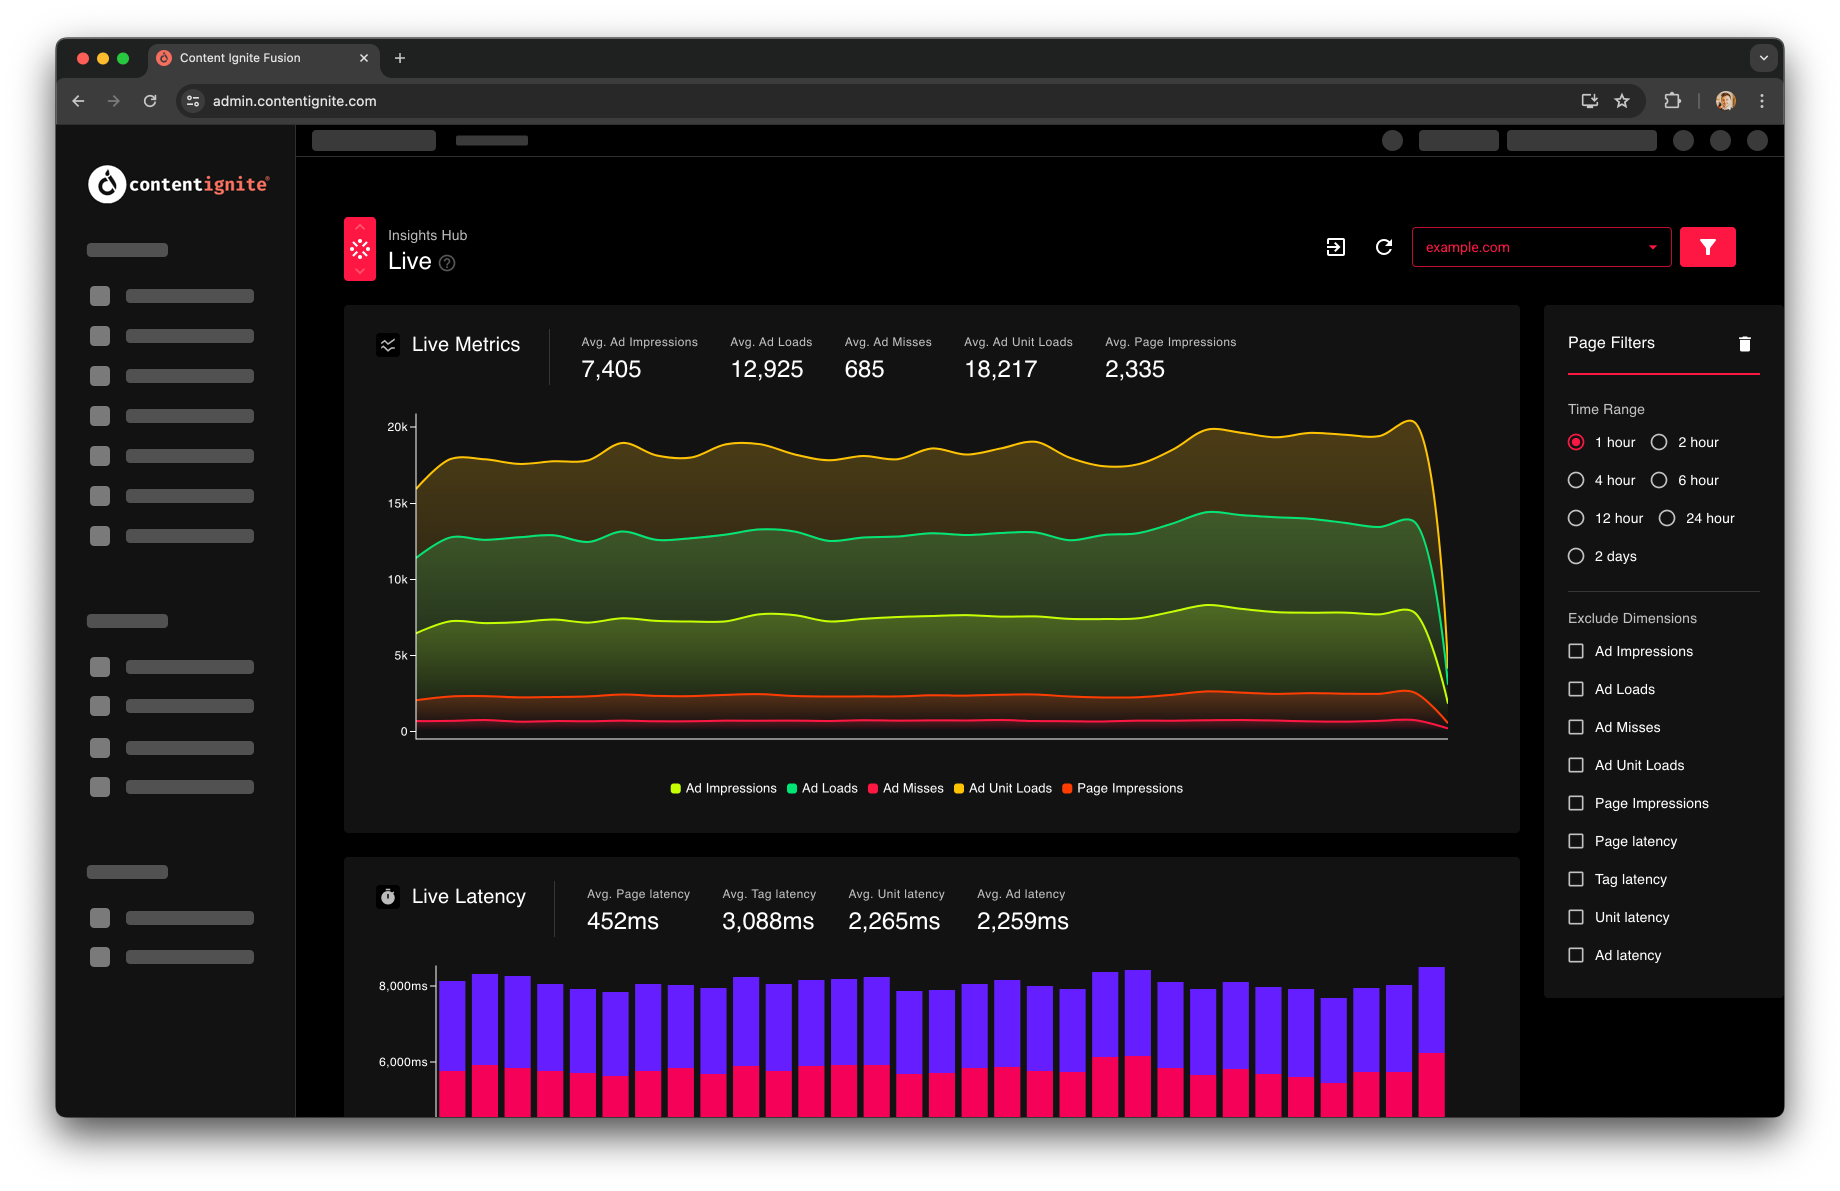
 Live reporting is a powerful real-time monitoring tool. Imagine you are about to deploy a new site template and want to be sure it hasn’t impacted your ad opportunities. This tool provides a second-by-second view of key metrics, as well as latency, so you’ll instantly know where things stand.
The “Live Metrics” graph displays key metrics such as ad impressions and page impressions, more info on these here.
The “Bid Rates” chart shows bid responses from the Ad Server, showing if a request filled or not. Its worth remembering that if you have a house campaign running in the Ad Server, fill will look impressively close to 100%.
The “Header Bidding” chart shows data from Prebid (if used). This gives a much more granular breakdown of bid events, showing when a bid request won, lost, didn’t bid or got throttled through bid throttling.
The “Live Latency” chart shows tag latency stats, which you can read more on here.
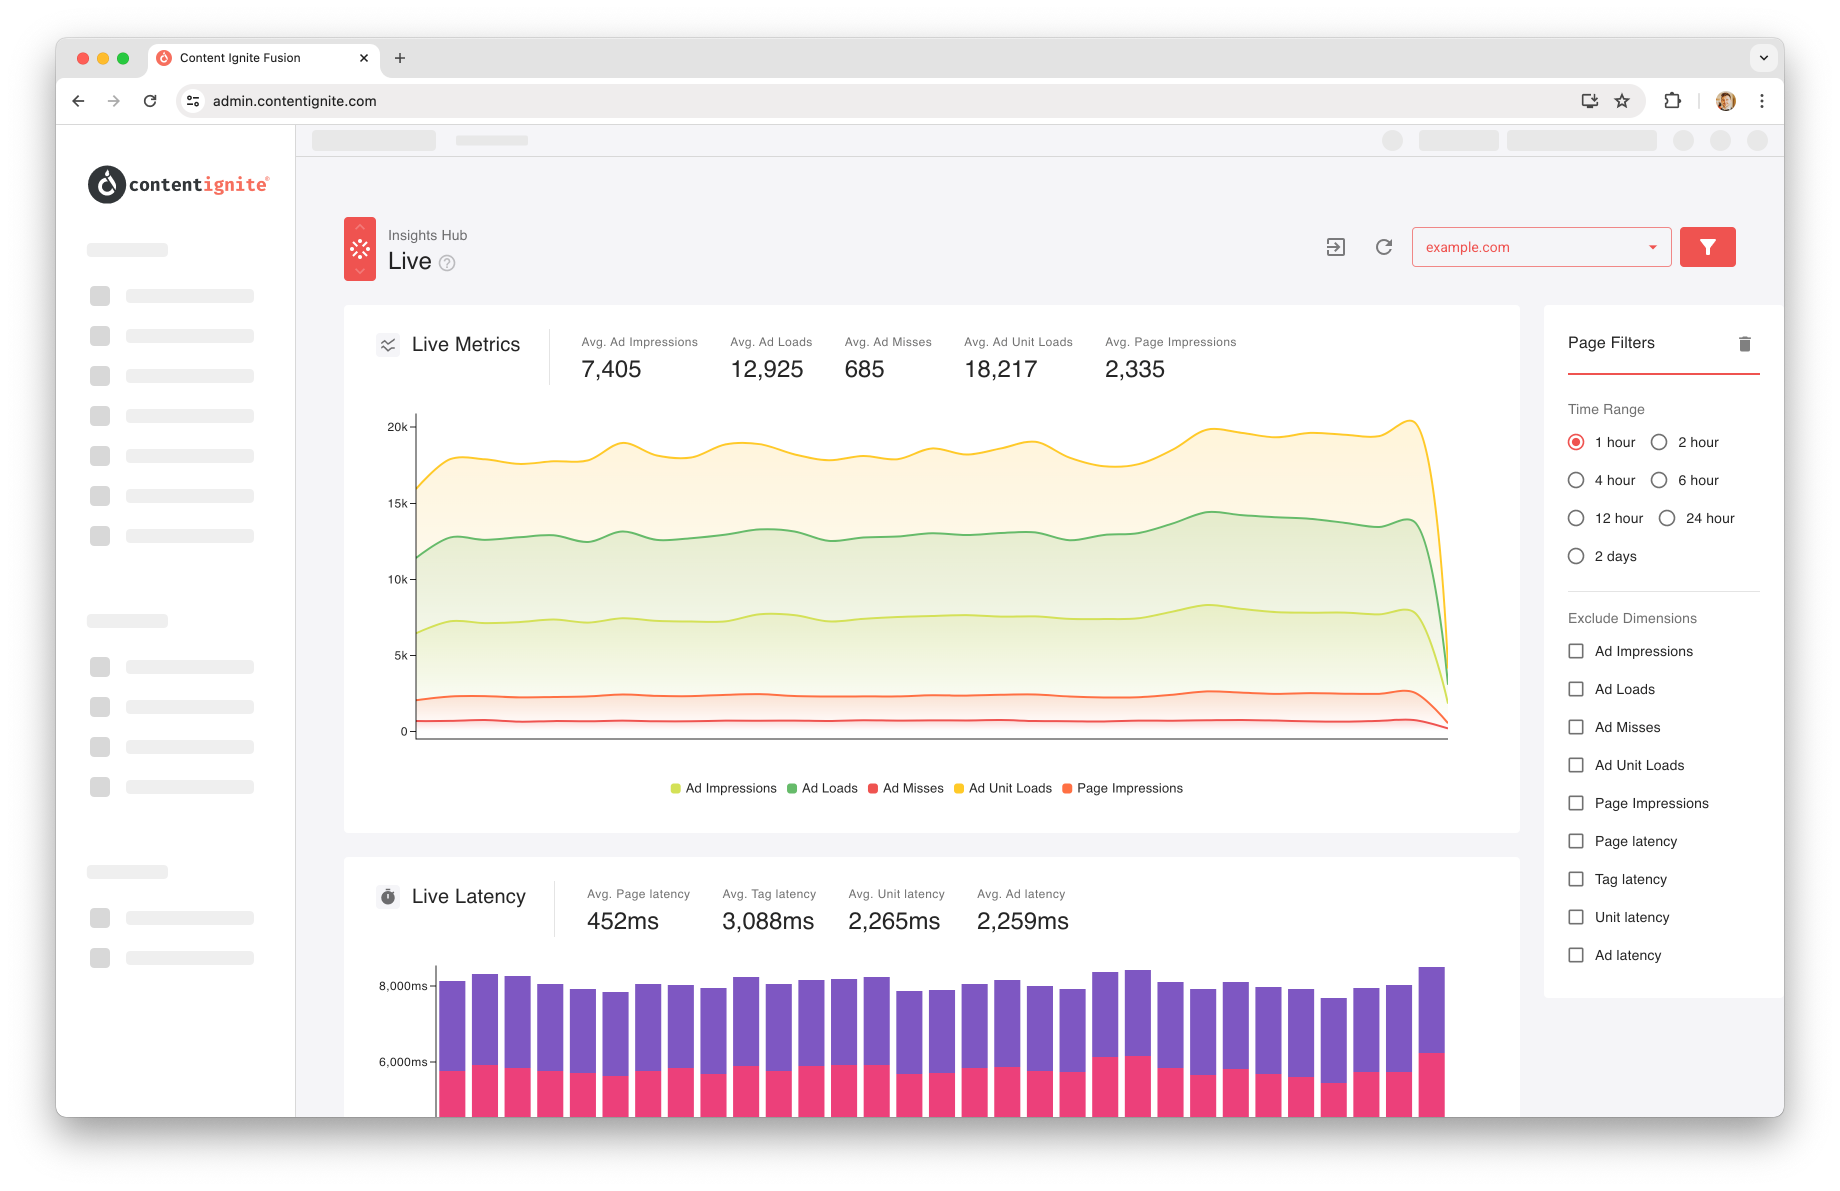
You can use the filter draw to remove metrics from the charts, helping you focus on what matters most. For example, if ad impressions are overshadowing page impressions, you can hide them for a clearer view.
Live reporting is a powerful real-time monitoring tool. Imagine you are about to deploy a new site template and want to be sure it hasn’t impacted your ad opportunities. This tool provides a second-by-second view of key metrics, as well as latency, so you’ll instantly know where things stand.
The “Live Metrics” graph displays key metrics such as ad impressions and page impressions, more info on these here.
The “Bid Rates” chart shows bid responses from the Ad Server, showing if a request filled or not. Its worth remembering that if you have a house campaign running in the Ad Server, fill will look impressively close to 100%.
The “Header Bidding” chart shows data from Prebid (if used). This gives a much more granular breakdown of bid events, showing when a bid request won, lost, didn’t bid or got throttled through bid throttling.
The “Live Latency” chart shows tag latency stats, which you can read more on here.
You can use the filter draw to remove metrics from the charts, helping you focus on what matters most. For example, if ad impressions are overshadowing page impressions, you can hide them for a clearer view.
Insights Hub
Live
Minute by minute data for the time critical transient moments
Live reporting is a powerful real-time monitoring tool. Imagine you are about to deploy a new site template and want to be sure it hasn’t impacted your ad opportunities. This tool provides a second-by-second view of key metrics, as well as latency, so you’ll instantly know where things stand.
The “Live Metrics” graph displays key metrics such as ad impressions and page impressions, more info on these here.
The “Bid Rates” chart shows bid responses from the Ad Server, showing if a request filled or not. Its worth remembering that if you have a house campaign running in the Ad Server, fill will look impressively close to 100%.
The “Header Bidding” chart shows data from Prebid (if used). This gives a much more granular breakdown of bid events, showing when a bid request won, lost, didn’t bid or got throttled through bid throttling.
The “Live Latency” chart shows tag latency stats, which you can read more on here.
You can use the filter draw to remove metrics from the charts, helping you focus on what matters most. For example, if ad impressions are overshadowing page impressions, you can hide them for a clearer view.