 This reporting view gives you graphical insight into various core metrics. On top of expected tag metrics and revenue data, you can view live revenue for the day so far, as well as latency stats - helping you understand your site’s performance and how it might be impacting earnings.
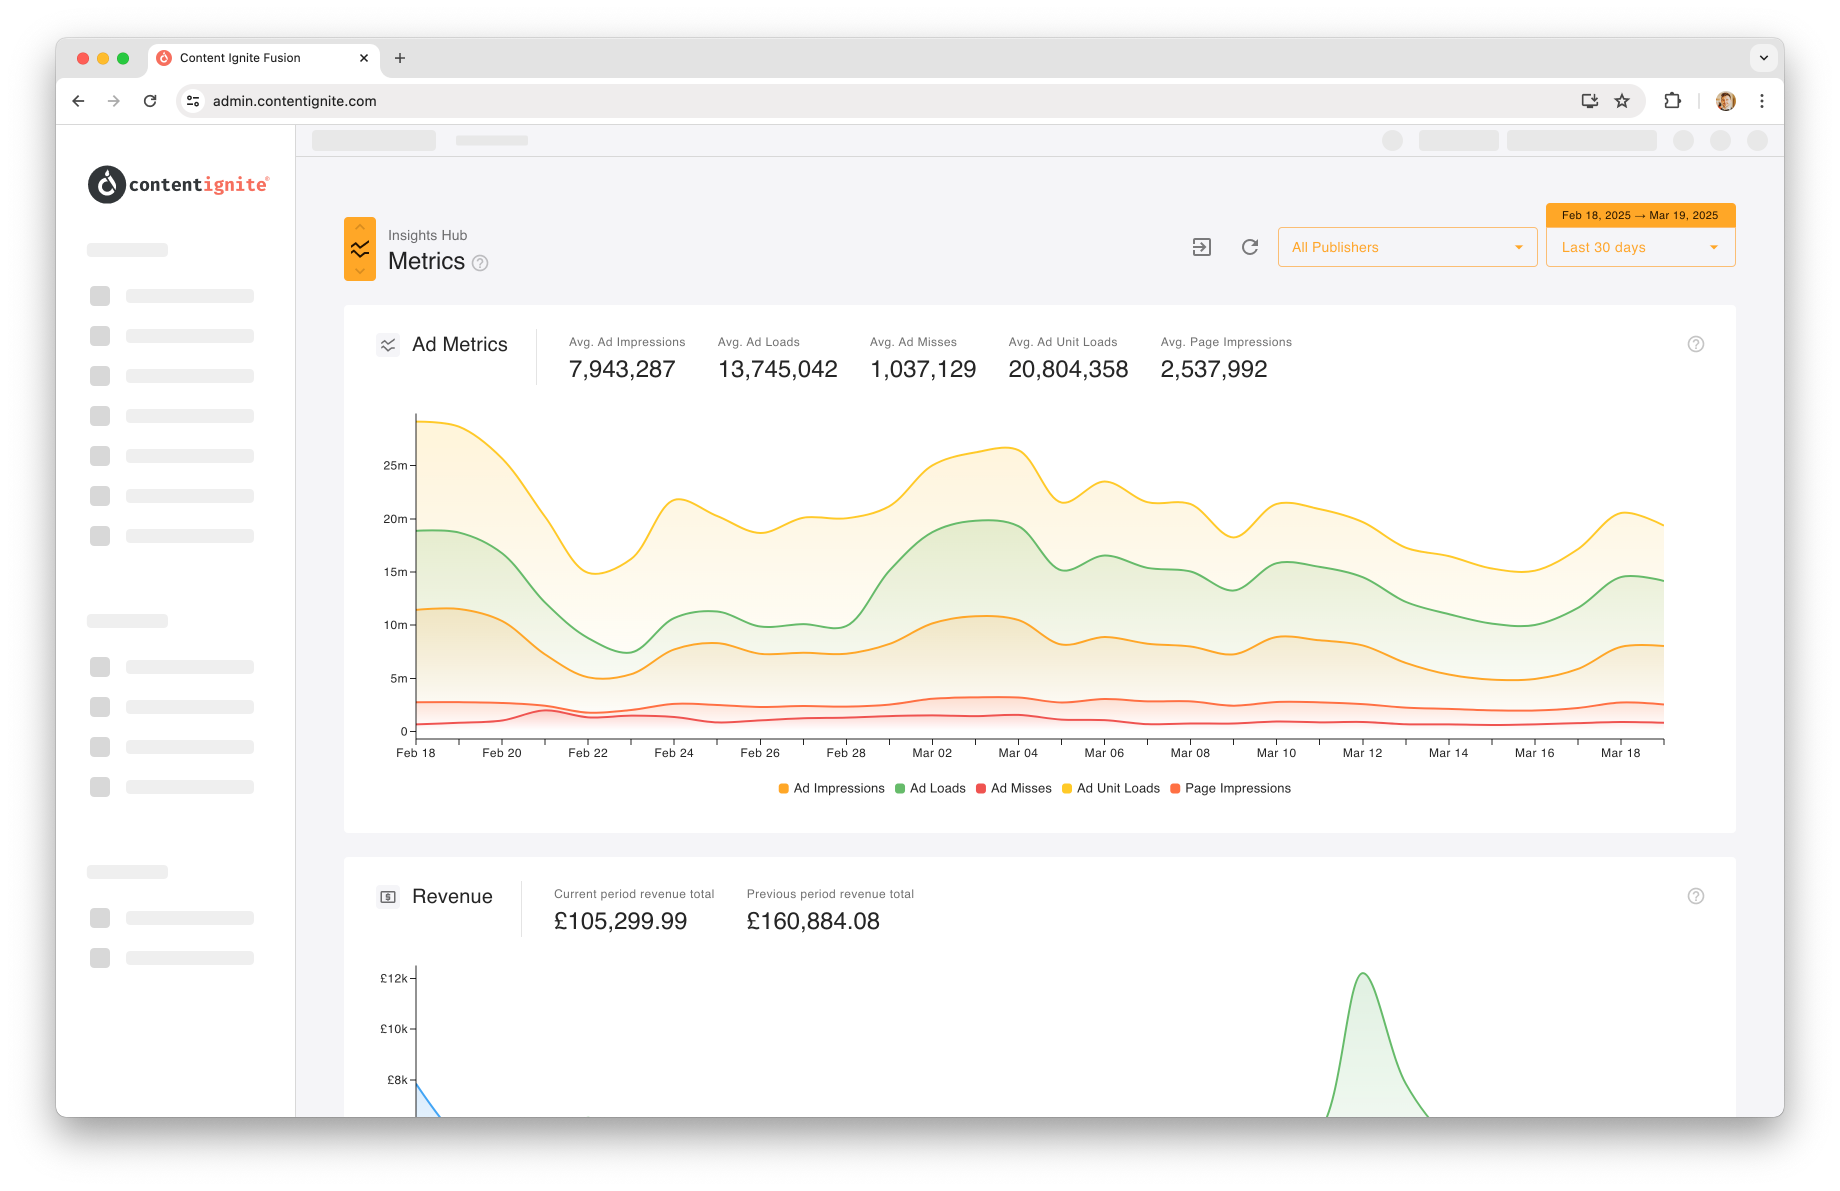
Ad Metrics
View 30 days of key tag metrics, such as page impressions and ad impressions. Use this graph to spot anomalies that might help explain publisher performance. Page impressionsThis is the number of pages our tag was loaded on Ad unit loads
This is the number of times we have found a target match on page, and are ready to serve ads. However, our in-view technology won’t load an ad until that unit is scrolled into view. So this metric may be higher than ad impressions. You can think of this as “ad opportunities”. Ad loads
This is the raw count of how many ad requests actually returned an ad (filled). Ad misses
This represents the number of ad requests that didn’t return an ad. This could be due to legitimate reasons, such as yield optimisation, where we push for higher CPMs, reducing fill but increasing revenue. Alternatively, an ads.txt issue could cause decreased ad responses if partners are not authorised to bid. Ad impressions
This is the number of impressions received on an ad, meaning the ad was successfully returned and fully rendered on the page (all images and scripts downloaded). This will be lower than “ad loads”, as users may exit the page between an ad being returned and the ad fully rendering to page.
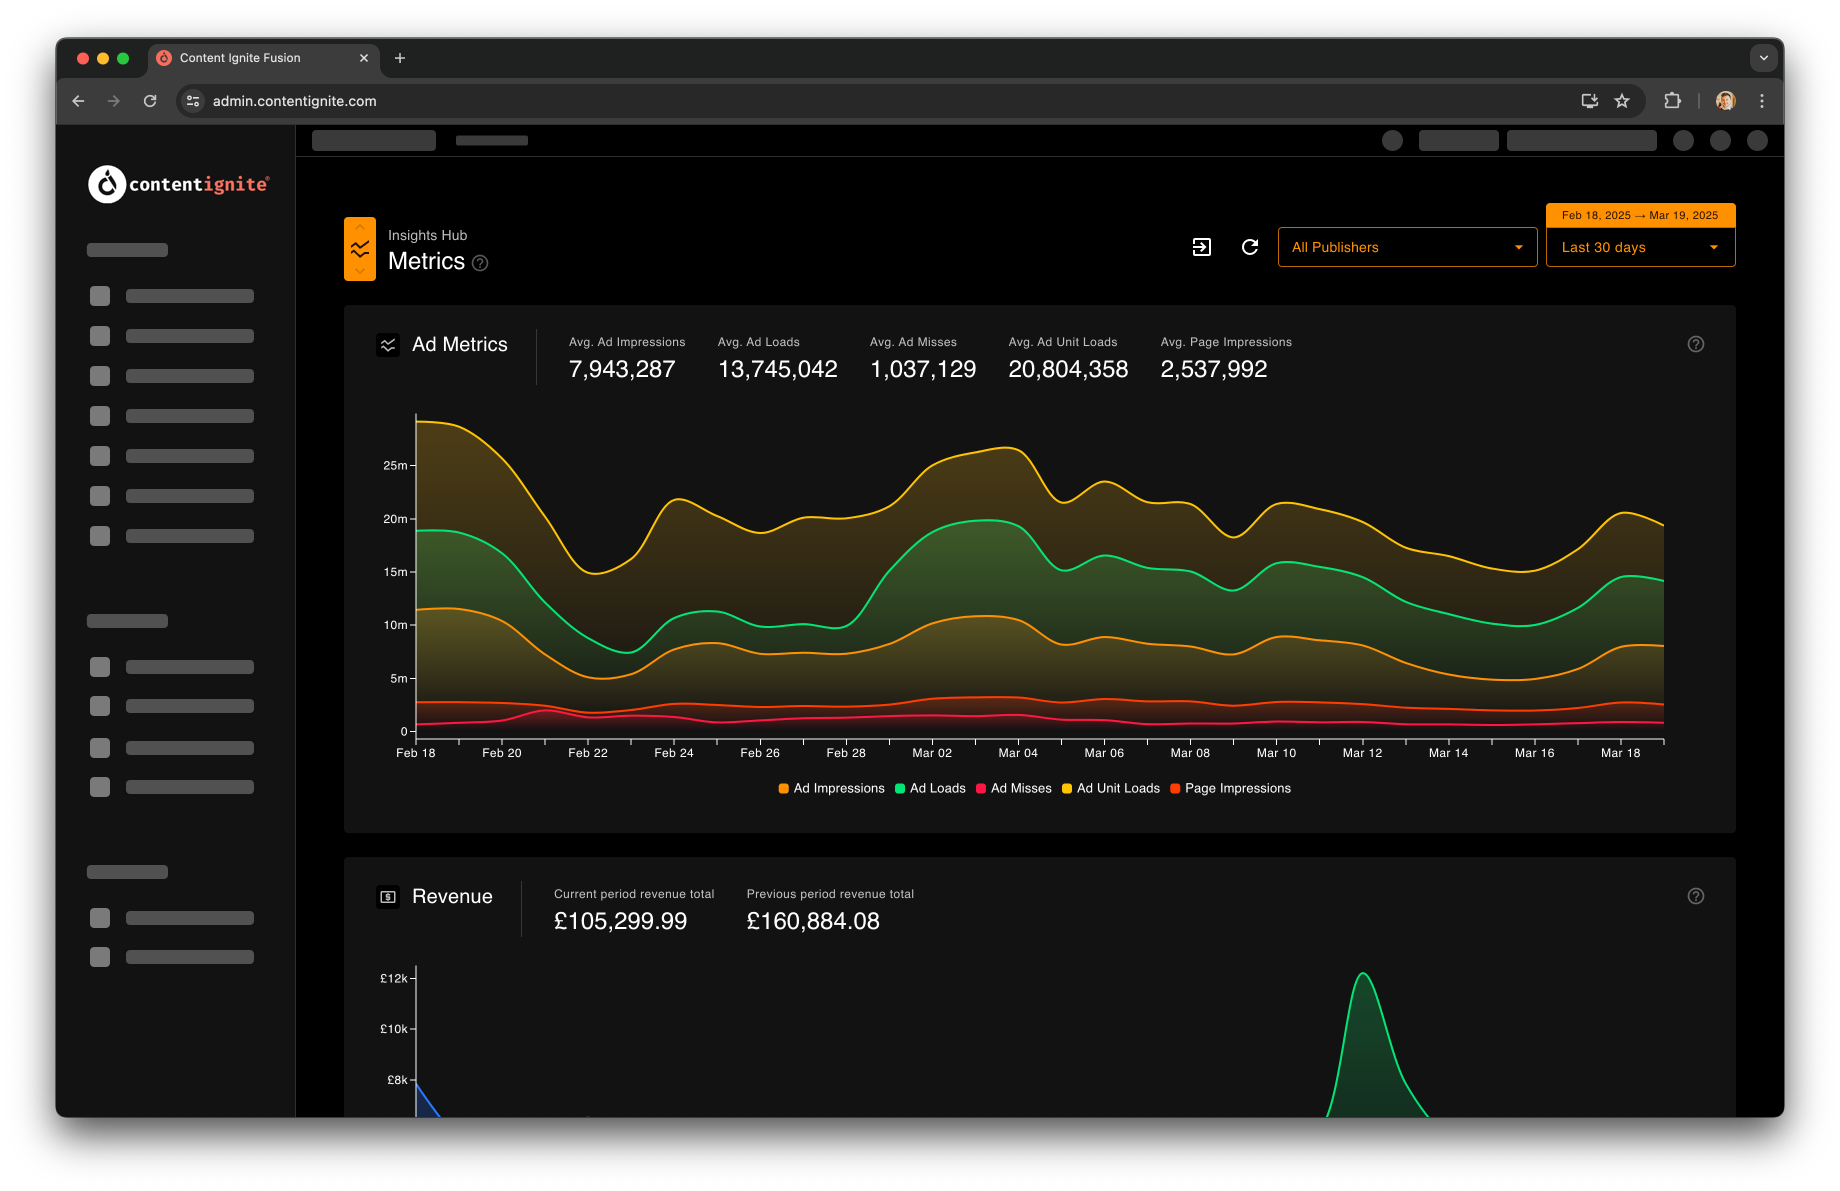
Revenue & CPMs
View your revenue trends for the current 30-day period, the previous 30-day period, and 30 days offset by a week. This provides solid comparisons to your current revenue performance. Along with the ad metrics graph above, trends should be easily identifiable. The same can be seen in a “CPM” view, offering a slightly different take on earnings.Live Hourly Revenue
View today’s hourly revenue in comparison to yesterday and the same time last week. We extrapolate today’s data to provide a revenue prediction. Use this graph for a quick visual on how today is shaping up. Note: Revenue is reported from Google Ad Manager, which is typically 2-3 hours behind “live” data.Latency Stats
An important part of advertising is latency. Ads won’t be effective if they take 10 seconds to load on the page, as the user might have finished reading the article by then! This is where our latency stats come in. Some stats are completely under the control of the publisher, while others are controlled by the Content Ignite Publisher Tag but are heavily impacted by general page performance. The top stat in this section is “Page to Ad Load,” which measures the time from when your page is first delivered to the user’s browser to when the user sees an ad. As you’ll see below, several factors impact latency, many of which relate to general page performance. We aim for this value to be around 3,000ms (3 seconds), bearing in mind that the page itself is loaded within that time period before our tag. Page LatencyThis is an important metric. It measures how long it takes to load our script on the page, from the point of page load to tag load. Completely under the control of you, the publisher, this is often the biggest cause of latency issues. Direct tag-on-page integrations will typically see the smallest latencies here, followed by setups like Google Tag Manager, and lastly, serving via an ad server. Introducing delays in this process will have a direct impact on earnings. Other contributors to poor latency can include heavy use of JavaScript, which may cause competition between scripts and slow down your Publisher Tag. We’d typically expect page latency to be under 250ms. Tag Latency
This measures how long it takes for our tag to be downloaded by the user’s browser and to be ready to start setting up ads. Our tag is served via a global CDN, typically taking around 40ms to be delivered. Therefore, the rest of this portion of latency is likely caused by either:
- User Internet Speed: Slow internet or low bandwidth can take longer to download resources
- Site Resource Use: If your site requests many different resources (images, scripts, etc.), those resources may be queued up, as browsers can only download so many at one time, causing a delay
This measures the time it takes for us to find the ad unit targets on the page, load in the ad unit, and be ready to request ads. This is typically only effected by general page performance, such as other scripts trying to execute. We’d typically expect unit latency to be under 500ms. Ad Latency
Ad latency represents the time from when we call the ad server to request an ad, until we receive a response. Ad server response times can be affected by the user’s internal speed, as well as other page resource requests and the number of bid partners. Content Ignite continuously scores our bid partners to ensure they are performing well. Any partners that are not are removed, helping to keep the number of partners to a minimum and balancing speed and revenue performance. We typically see ad latency around 700ms.