 The Revenue Analytics Insights Hub combines direct publisher revenue data with integrated on-site Google Analytics metrics to offer a comprehensive view of earnings performance across a range of views.
By looking at Revenue Per Mille (RPM) alongside key analytic metrics - particularly users, page views, and sessions — Fusion offers a clear and balanced measure of monetisation performance. This helps publishers get a better handle on user engagement, spot profitable traffic sources and audience behaviours, and identify underperforming areas, revealing valuable insights to fine-tune their revenue strategy.
Publishers can explore a range of views accessible through top-level tabs, from a broad overview of key data points to with more detailed breakdowns of individual metrics for a deeper dive.
The Revenue Analytics Insights Hub combines direct publisher revenue data with integrated on-site Google Analytics metrics to offer a comprehensive view of earnings performance across a range of views.
By looking at Revenue Per Mille (RPM) alongside key analytic metrics - particularly users, page views, and sessions — Fusion offers a clear and balanced measure of monetisation performance. This helps publishers get a better handle on user engagement, spot profitable traffic sources and audience behaviours, and identify underperforming areas, revealing valuable insights to fine-tune their revenue strategy.
Publishers can explore a range of views accessible through top-level tabs, from a broad overview of key data points to with more detailed breakdowns of individual metrics for a deeper dive.
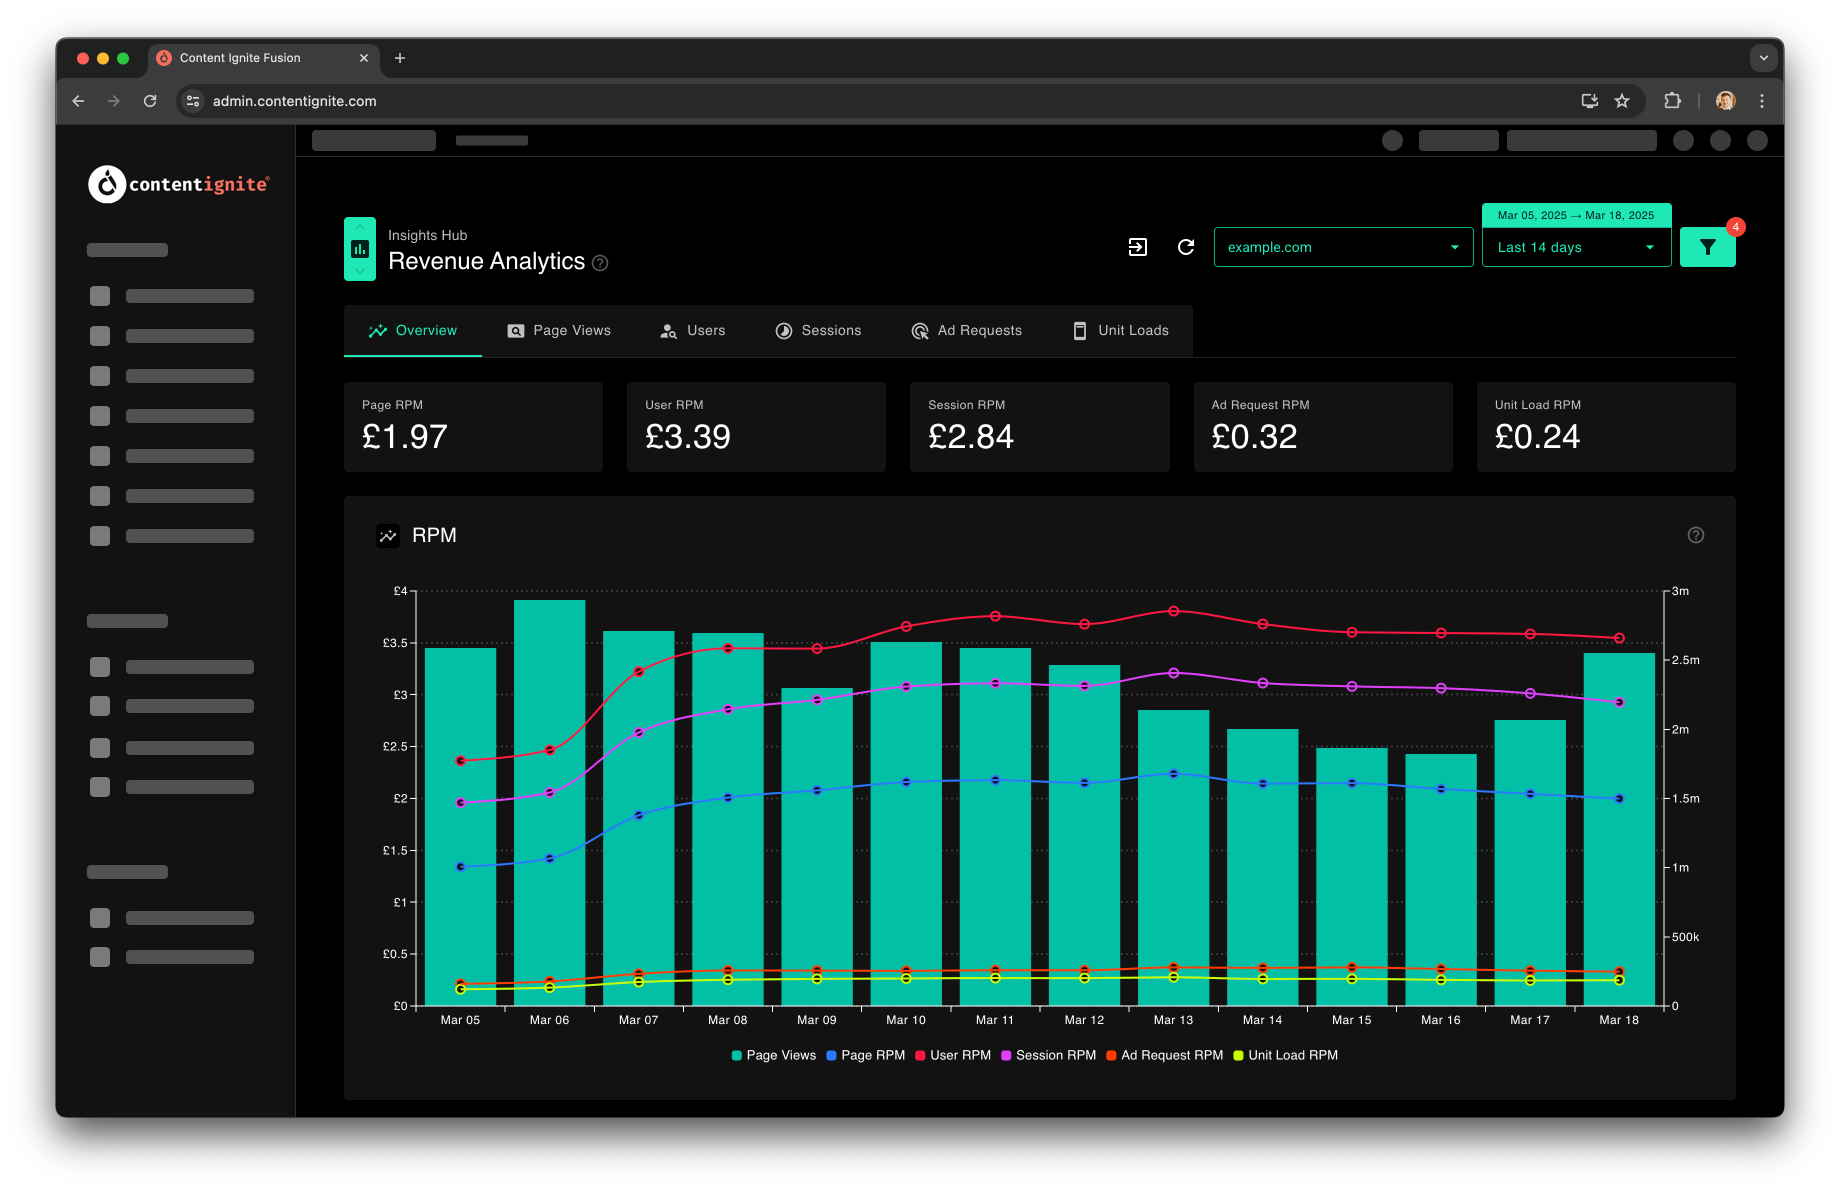
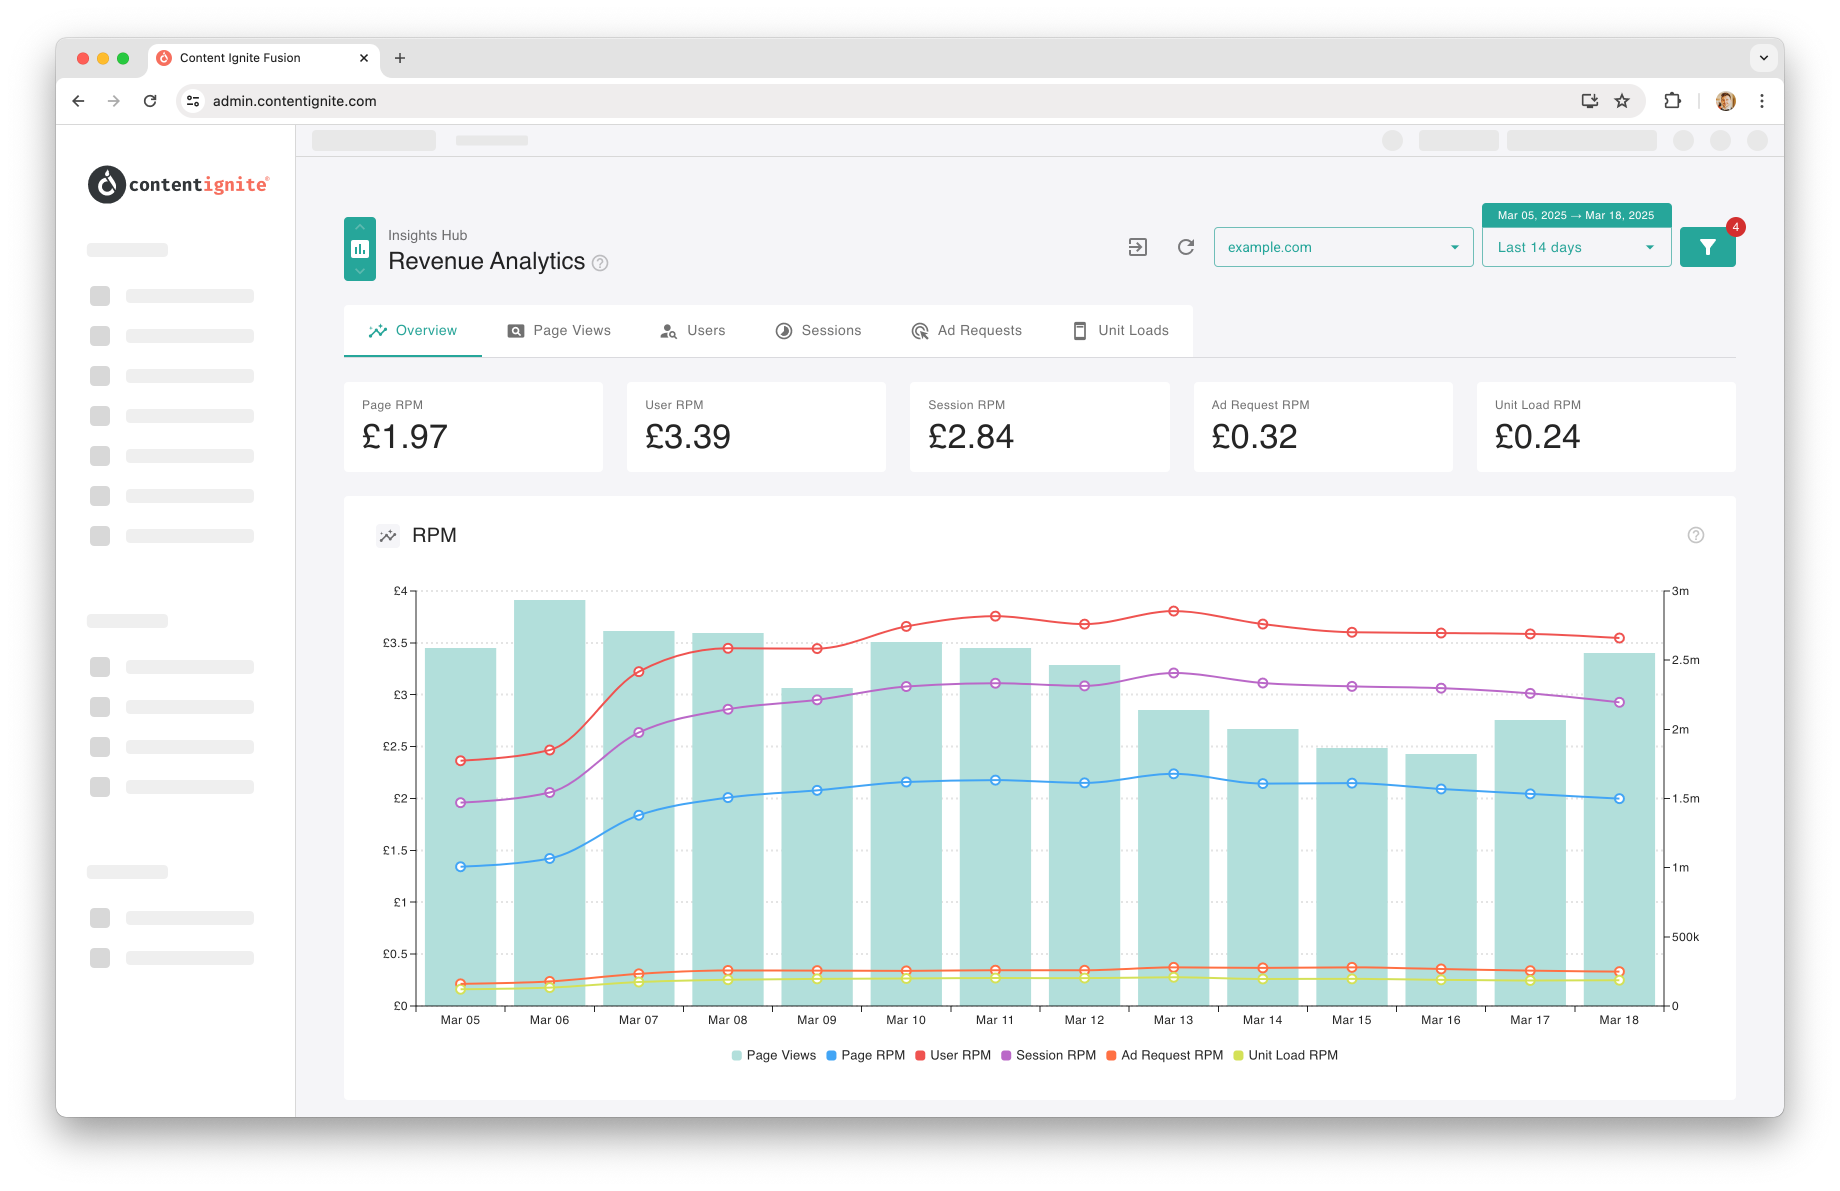
Overview
The Overview tab (default) consolidates key revenue analytics data with both statistical and graphical views. High-level stats provide a quick snapshot of RPM against each analytic metric, giving you an at-a-glance look at date-related totals. The RPM chart then break this down further, showing date trends for a deeper look into performance over time. Finally a fully exportable tabular view allows you to filter, sort, and analyse the data however you’d like.Single Views
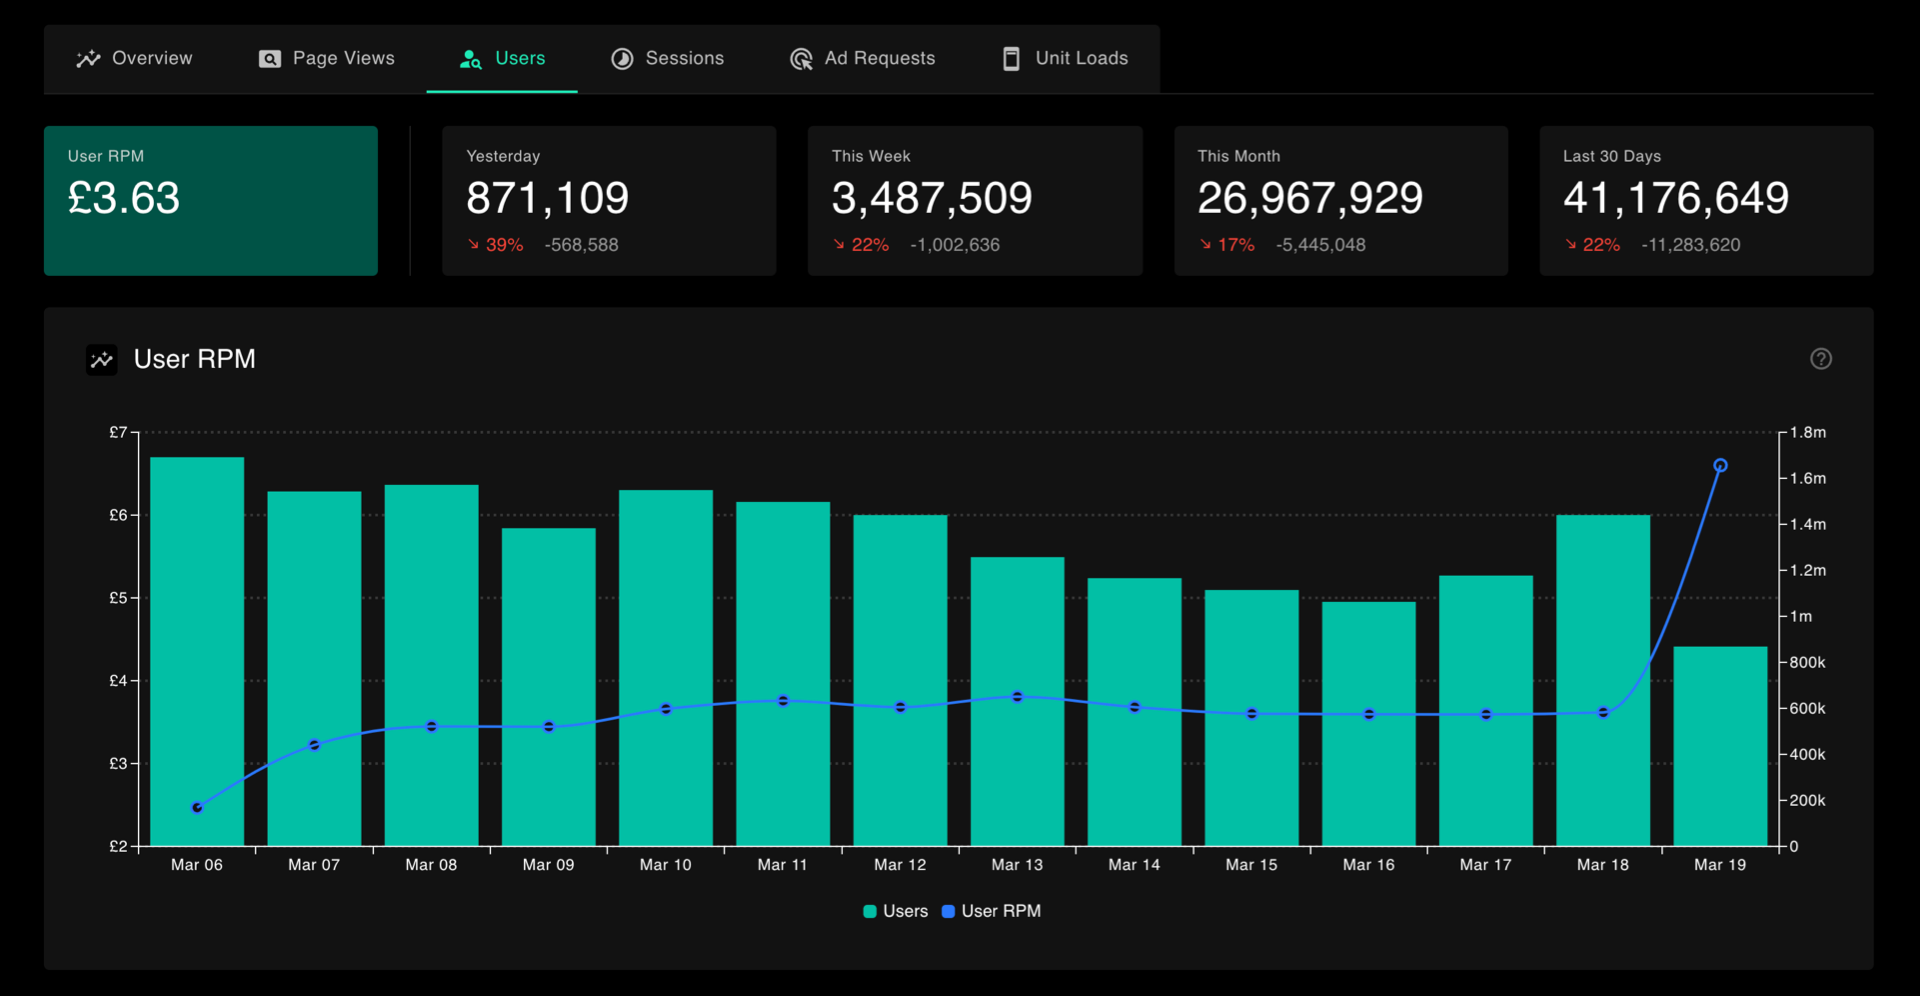
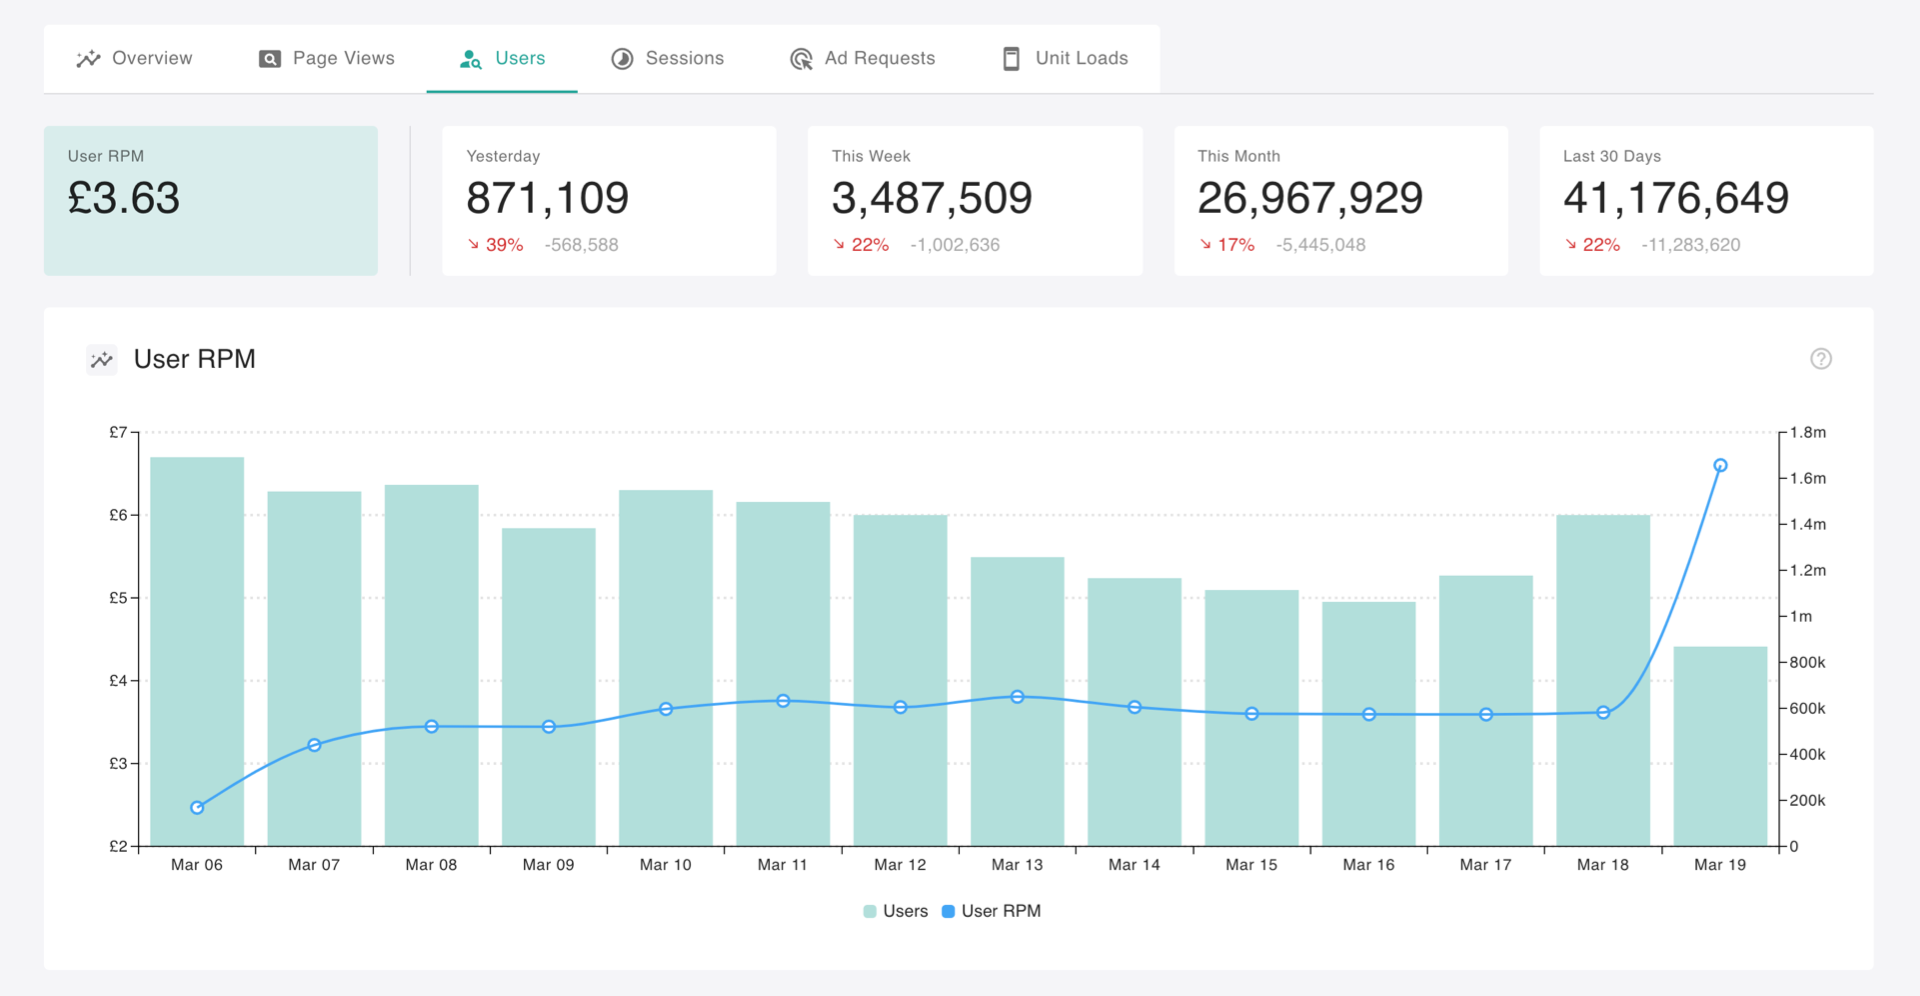 Each single view breaks down the data further by each analytics metric. These include:
- Page Views: The total number of times a page on a website was viewed, including multiple views by the same user.
- Total Users: The unique number of individuals who visits a site during a specific time period.
- Sessions: The total number of visits to a site, where each session includes all user interactions within a specified time window (typically 30 minutes).
- Ad Requests: The total number of times an ad gets requested from an ad server to be displayed on a page.1
- Unit Loads: The number of times an ad successfully loads on a page after being requested.1
Filter options
In addition to the date filters that apply to the page, there are some page filters that enable some further customisations to the views. These include: Revenue Type ToggleSwitch between Gross and Net figures for RPM to view earnings in the preferred format. Metric Toggle:
Easily turn chart metrics on or off to customise the graphical view in the Overview. These filter options make it easy to refine the data and focus on the insights that matter most.
Getting Connected
In order for Fusion to track a publisher’s analytics data, an analytics partner first needs to be connected in the Integrations section. A check for this is done initially, and if setup is required, publishers can simply follow the steps to get connected and start pulling in data right away.

GA Reporting
When viewing data by month, quarter, or other larger date ranges that dynamically group daily data (charts only), you may notice that User and Session totals appear higher than expected. This is not a bug — it’s due to how GA4 calculates unique users and sessions across longer periods. At a daily level, a user is counted once per day, even if they visit multiple times. When GA4 aggregates data over a longer period, it applies deduplication using internal user identifiers to calculate “unique” totals. This ensures the official totals in GA4 reflect the actual number of distinct users and sessions across the range.How Fusion handles this
Fusion pulls GA4 data daily, which avoids duplication at the day level. For charts that display trends over time, we sum these daily totals. This means that a user who visits on multiple days will be counted once per day, but multiple times when totals are summed for a week, month, or quarter. For aggregated totals across a custom date range (e.g., “Total users last 30 days”), Fusion fetches data directly from GA4 in real time. This ensures GA’s deduplication is preserved, giving you the most accurate totals without inflating numbers.What this means
- Summing daily figures manually may show higher User and Session counts than GA4’s official totals.
- This can result in slightly lower RPM values when calculated from summed daily data versus totals pulled directly from GA4.
- For fully accurate totals and calculations (especially for grouped date ranges), it’s best to query GA4 directly and use the resulting revenue figures for RPM calculations.
- Figures are never 100% final, as GA can adjust totals after the data is fetched. Always refer to GA reports for completely accurate numbers.