Revenue Report
The revenue report is your main insight into publisher performance. Giving you a highly transparent breakdown of costs and even the viewability of impressions.
These reports are designed to be built for your needs, allowing complete customisation over date ranges, fields and filters.
GAM integration without reporting
If you chose to use your own Google Ad Manager account, and connect it in without reporting, or opt for the manual integration option, you will see substantially less in this report.
You will get a basic impressions report (which is what your billing is based on) broken down by ad unit.
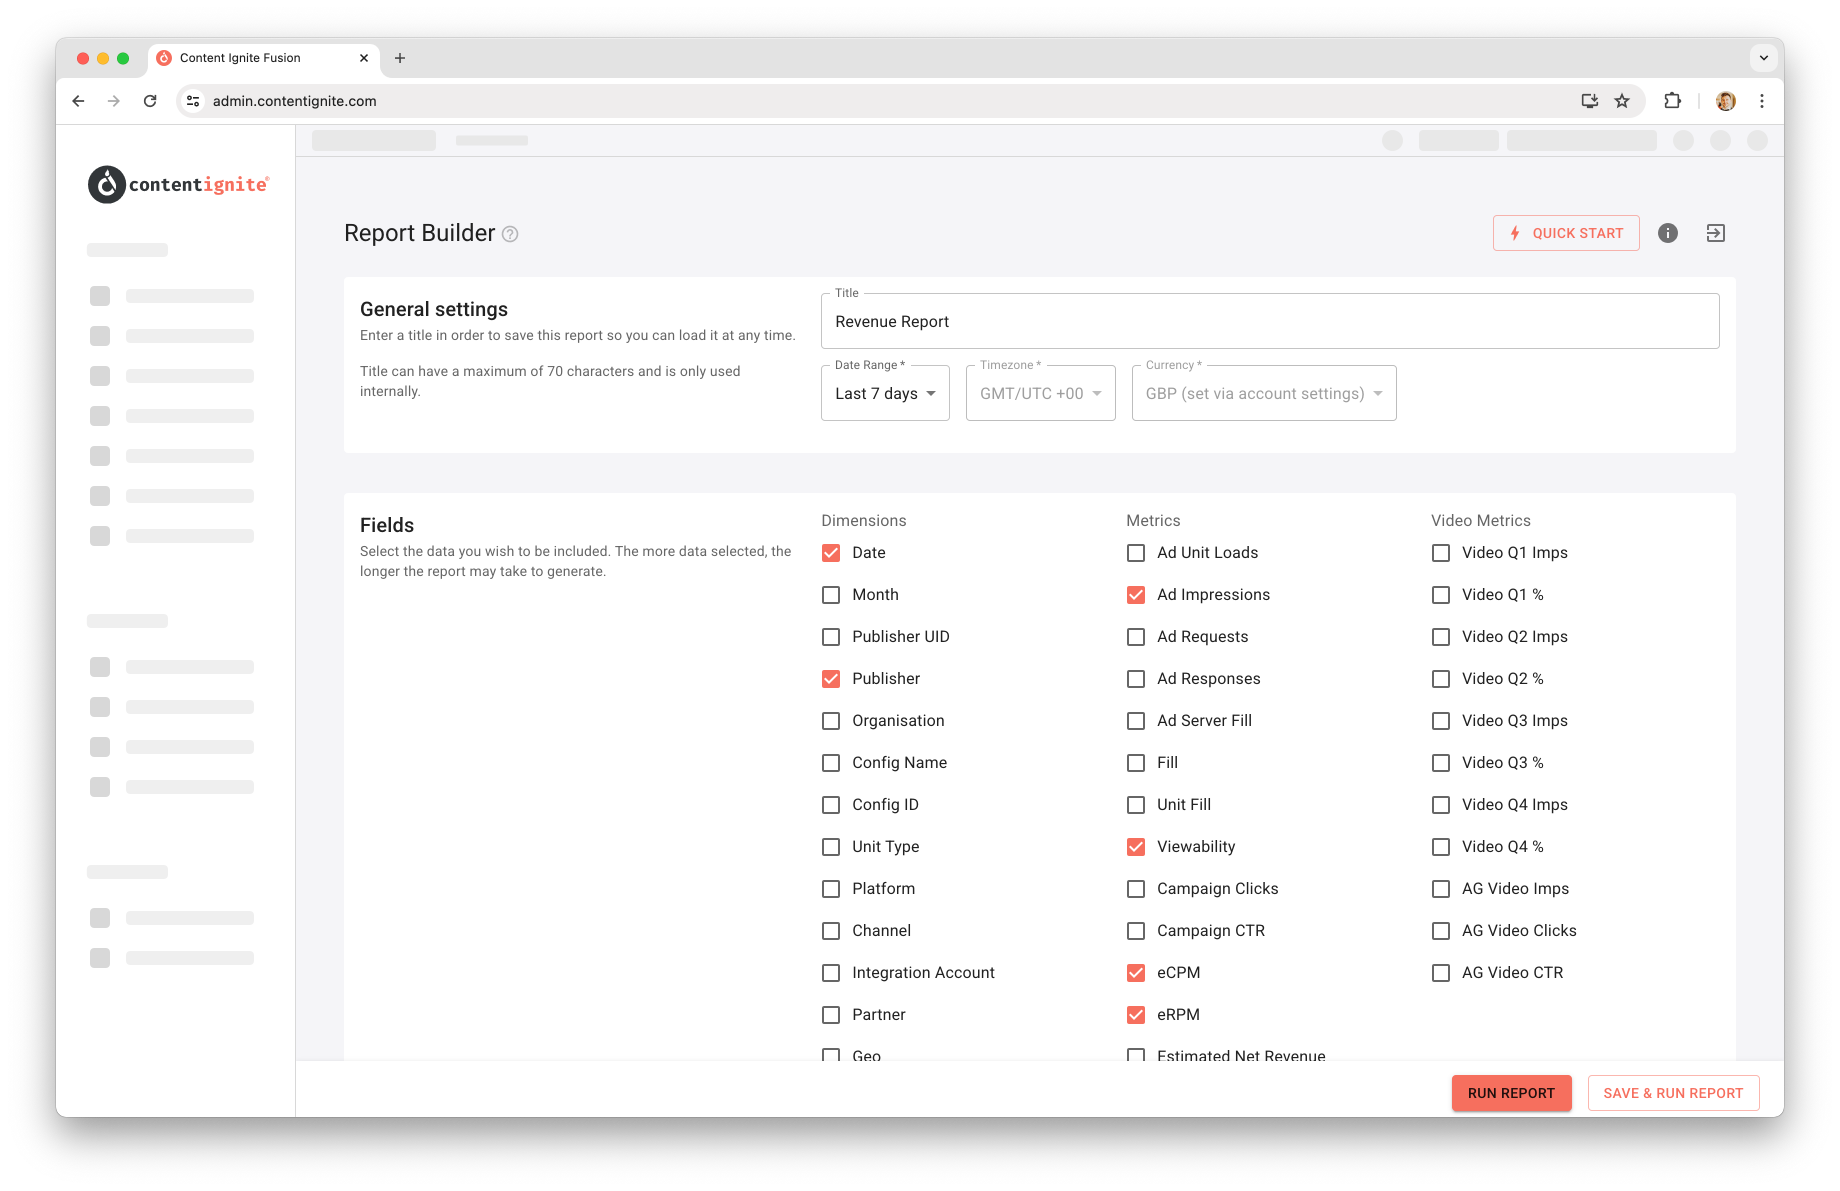
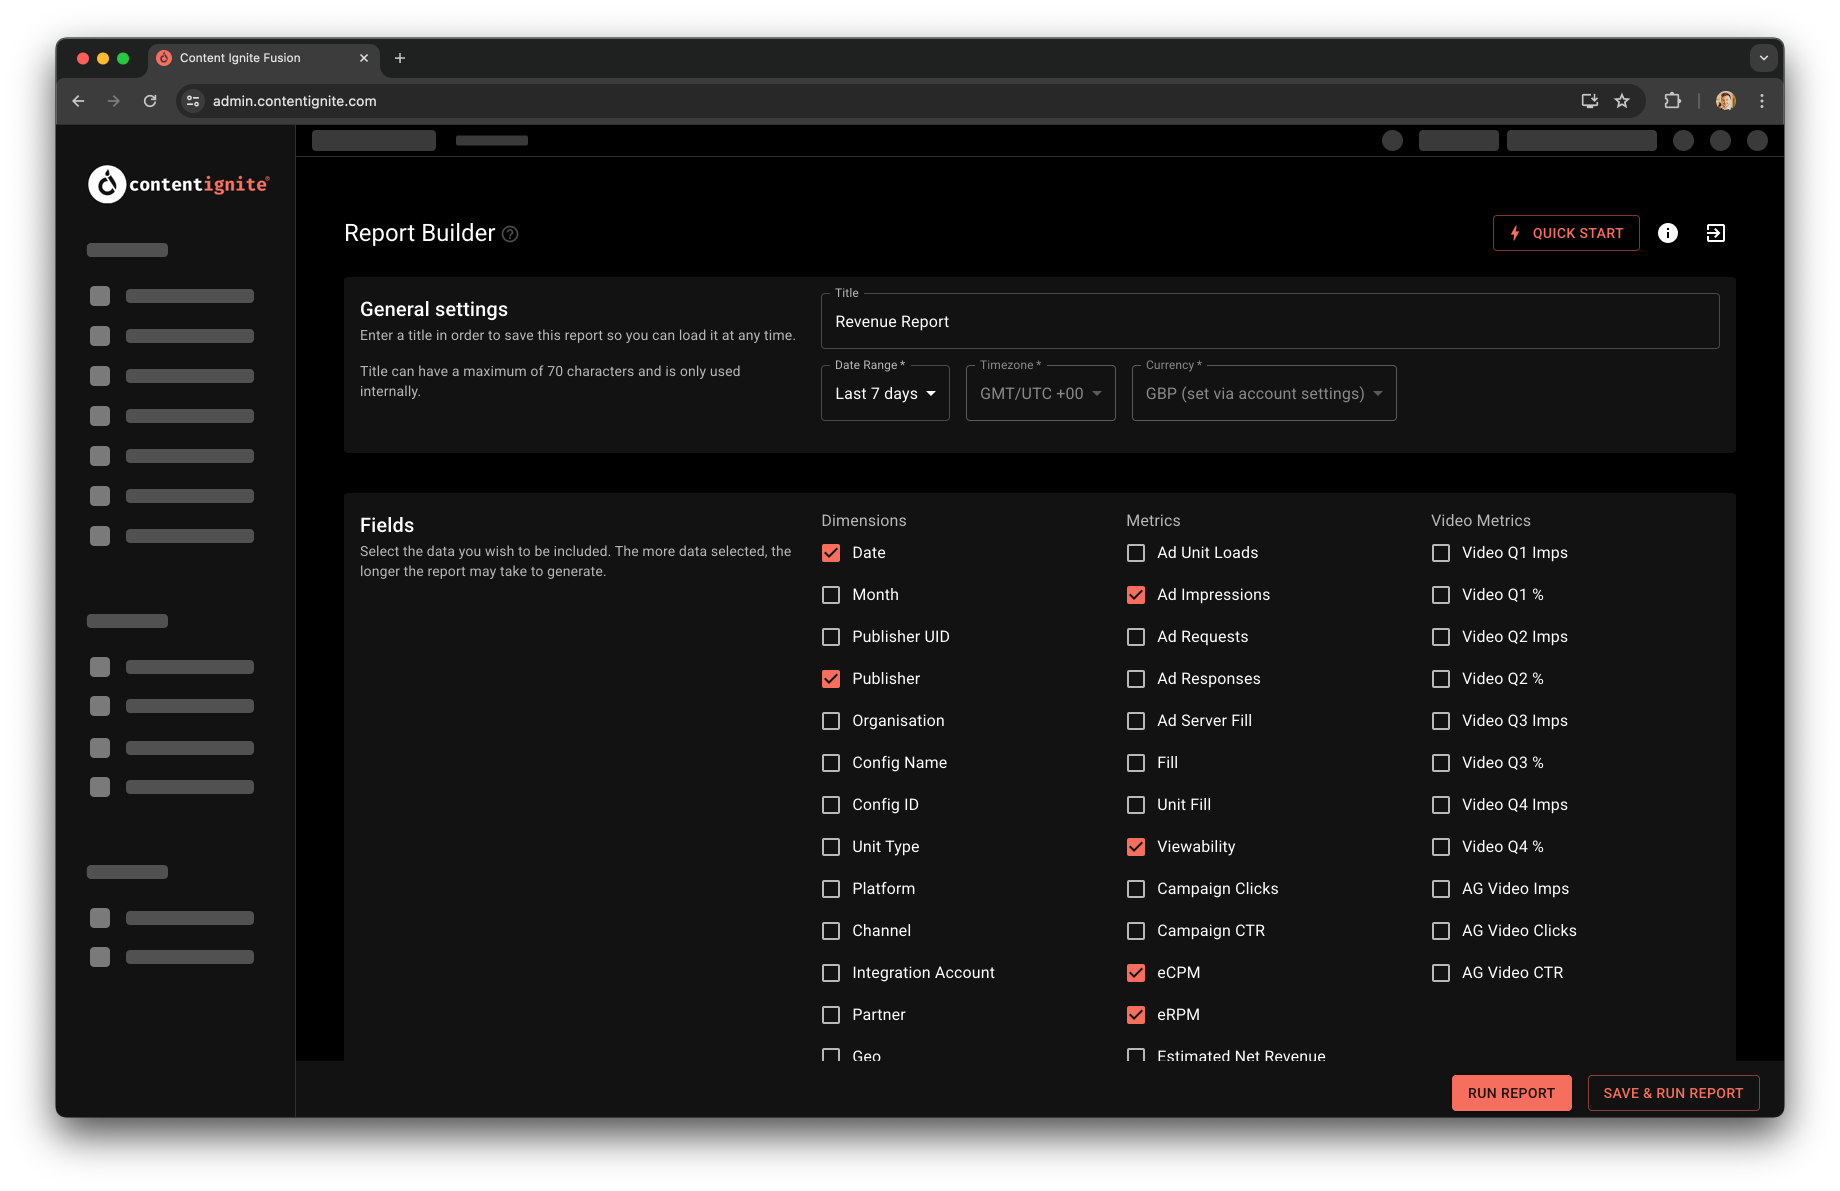
Building your report
Clicking "New report" will take you to the report build view, where you can select you data range, fields and filters.
If you give your report a title you can save it for re-use later, or to just generate a one off report, you can simply click "Run" after you have made your selections.
Available Fields
There is a large amount of data available via this report, explanations of each column can be found by hovering over the field in the report builder interface, or over the column header if you have already ran the report.
Due to the complexities of advertising, you will likely come across a column that doesn't make sense against another column like "How can ad responses be higher than ad impressions?" or columns that sound similar where the differences aren't immediately clear. These are valid and common questions, so to help we have listed answers to common questions in the help modal accessible from the info icon in the top right, or via Field Nuances further down this page. Got a question we haven't answered? Reach out and lets us know, as it could help others too!
| API Field Name | Corresponding UI Name | Field Description |
|---|---|---|
| account_name | Account Name | Account name of the primary platform e.g. your ad server |
| ad_impressions | Ad Impressions | Total impressions served by the ad server |
| ad_requests | Ad Requests | Total number of requests sent to the ad server |
| ad_responses | Ad Responses | Total number of ad requests that successfully returned an ad |
| ad_unit_loads | Ad Unit Loads | Number of times a target match was found on page (not necessarily number of ads requested) |
| ag_video_clicks | AG Video Clicks | Number of recirculation click on an auto-generated video |
| ag_video_ctr | AG Video CTR | Percentage of auto-generated video views that clicked through to the article |
| ag_video_impressions | AG Video Imps | Number of impressions on an auto-generated video |
| channel | Channel | The method buyers used to access your inventory via the ad server |
| clicks | Campaign Clicks | Total campaign clicks |
| config_id | Config ID | The ID of the config that matched and served the ad request |
| config_name | Config Name | The name assigned to the config (if available) |
| creative_size | Creative Size | The creative size served |
| ctr | Campaign CTR | Percentage click through rate for the given campaign |
| date | Date | Date revenue is attributed to |
| month | Month | The year and month revenue is attributed to |
| device | Device | Device category (desktop,mobile or tablet) |
| ecpm | eCPM | Average cost per 1,000 impressions |
| fill | Fill | The percentage of ad requests that returned an ad |
| geo | Geo | Country iso-code |
| gross_revenue | Gross Revenue | Total revenue |
| line_item | Campaign Name | This is the campaign name for your direct sold |
| net_revenue | Estimated Net Revenue | Estimated publishers share of revenue |
| oid | Organisation ID | Organisation ID |
| organisation | Organisation | Organisation name |
| partner | Partner | Name of the ad network that sent the winning bid |
| platform | Platform | Name of the primary platform e.g. your ad server or demand partner connection |
| publisher | Publisher | Publishers domain plus optional label |
| q1_impressions | Video Q1 Imps | Number of times that a video plays to 25% of its length |
| q1_percent | Video Q1 % | Percentage of views that played to 25% of videos length |
| q2_impressions | Video Q2 Imps | Number of times that a video plays to 50% of its length |
| q2_percent | Video Q2 % | Percentage of views that played to 50% of videos length |
| q3_impressions | Video Q3 Imps | Number of times that a video plays to 75% of its length |
| q3_percent | Video Q3 % | Percentage of views that played to 75% of videos length |
| q4_impressions | Video Q4 Imps | Number of times that a video plays to completion |
| q4_percent | Video Q4 % | Percentage of views that played to video end |
| rpm | eRPM | Estimated publisher revenue per 1,000 ad requests |
| uid | Publisher UID | The internal unique ID for the publisher |
| unit | Unit Type | Unit type e.g. In-image |
| unit_fill | Unit Fill | The percentage of ad unit loads that returned an ad (can be over 100% if refresh is enabled) |
| viewability | Viewability | Ad impressions that were deemed "viewable" |
Field Nuances
(Estimated) Net Revenue
If you are using only Content Ignite ad demand (P&P) then net revenue is straight forward, it will be the gross earnings with your revenue share applied, and outside of the 4 day reconciliation period, can be relied upon and will match your invoiced payout.
However, things get a little more complex for SaaS customers, as fees are calculated from ad usage, which has a tiered pricing structure applied, so with greater volumes, discounted rates apply. Meaning that as you progress through a month, the RPM value may decrease. Net revenue will also rarely match your invoice amount because ad usage is calculated from all units across your entire network for the month as a whole, so pulling reports for single publishers or over varying date ranges means we have to estimate the billable impressions accordingly. This is why the fields are labeled as "estimate".
Ad unit loads vs Ad requests vs Ad responses vs Ad impressions
The lifecycle of an ad request starts with an ad unit load, this means we found a target match on the page, and our unit was loaded, ready to request an ad, however, our in-view technology may not make that request if the unit is out of view of the user. Therefore Ad unit loads can be higher than ad requests.
Ad requests are just that, requests to the ad server to ask for an ad. We typically aim for the highest yield for our publishers meaning the most revenue, and with that comes fill that is under 100%. If ad refresh is enabled, then ad request may be a lot higher than ad unit loads which only loads once per page load.
Ad responses mean the ad server has successfully returned an ad. As we don't aim for 100% fill, this will typically be less than ad requests.
Next, we have ad impressions. This means that we have taken the ad returned from the server, placed it on the page and all the images have been downloaded to the users' browser allowing the ad creative to be viewed by the user. This will typically be slightly lower than ad responses as users could navigate away from the page between receiving the ad response and rending the ad creative to the page.
Finally, we have viewable impressions. This is counted as having at least 50% of the ads area visible on the users' screen for at least one second. This is typically less than ad impressions, again as the user could navigate or scroll away before this threshold is met.
Viewability
Viewability values are for GAM demand only, these stats are not provided by our OpenWrap integration partners.
Unit Fill vs Fill
Fill is the common ad reporting metric of ad responses divided by ad requests, to give you a percentage of how many ad requests actually returned an ad. It is worth noting that Content Ignite does not aim for 100% fill, but instead aims for the highest yield, boosting the value of your inventory and maximising your revenue. Therefore, seeing blank ads is normal.
Unit fill is by contrast, a measurement of opportunity. It is calculated from ad responses divided by ad unit loads, which as detailed above, is when the intended target is found on page but has not necessarily triggered an ad request. This value can go above 100% if ad refresh is enabled.
Results Table Features
What may at first seem like a simple reporting table actually contains several powerful features that allow you to dice up and drill down into your data.
Clicking the three vertical dots next to any column header will give you several options:
Column Visibility & pinning
Clicking the "Show columns" option will allow you to hide fields you don't need in that moment, in order to achieve a focused view.
You can even pin or "freeze" columns to keep them in view as you scroll across large data sets.
Sorting
Click any column header to sort by that column, click again to reverse the sort or even hold down cmd (Mac), ctrl (Windows) and click multiple headers to achieve a multi-column sort!
Filtering
Filter any field with various options for comparison operators, and view a single ad unit's performance across a subset of your publishers for example.
Grouping
Reports are broken out into a granular view by default. Want to see a single daily summary by publisher instead? Use grouping to achieve just that.
Aggregation
Select from various aggregation functions such as average, count or sum to populate the summary footer with values. These are set to values that make sense for the given column by default but can be changed to suit your needs.
Saving and resetting table state
If you have reordered columns and adjusted sizes and sorting (among other things) you can save that layout for next time you (or anyone else) uses that report. Great for those dynamic date range reports that will get used time and time again.
You can of corse play around with filters etc and not save, to get the data you need in that moment.
You can also reset the table state back to how it started at any time with the "Reset" button.
API Reporting
You can pull all the same data you see in our UI, via our REST API. Your API access token can be found on your account page, and the API documentation can be found here: https://documenter.getpostman.com/view/4918700/UVXbtKZQ
For ease and speed, we recommend you set up your report in the UI and then pull it daily via the /v1/report/:id/data endpoint.
We also recommend you pull reports for a 7 day lookback period, as SSP's reconcile their reporting, meaning previous days data is not locked in until this period has lapsed.