Documentation Index
Fetch the complete documentation index at: https://docs.contentignite.com/llms.txt
Use this file to discover all available pages before exploring further.
 The Demand Mix Insight offers a detailed breakdown of how your ad inventory is distributed across various demand sources. Whether you’re using your own Ad Server setup (SaaS) or leveraging our Fully Managed/Plug & Play Ad Demand, this insight shows the flow of revenue across each source, allowing for easy comparison and deeper analysis. It also provides visibility into how your impressions, fill rate, and viewability are distributed, with the ability to break these down further by different dimensions, helping you monitor performance and make informed decisions for optimising your ad setup.
Here are the key tab views found in the Demand Mix Insight Hub:
The Demand Mix Insight offers a detailed breakdown of how your ad inventory is distributed across various demand sources. Whether you’re using your own Ad Server setup (SaaS) or leveraging our Fully Managed/Plug & Play Ad Demand, this insight shows the flow of revenue across each source, allowing for easy comparison and deeper analysis. It also provides visibility into how your impressions, fill rate, and viewability are distributed, with the ability to break these down further by different dimensions, helping you monitor performance and make informed decisions for optimising your ad setup.
Here are the key tab views found in the Demand Mix Insight Hub:
Overview
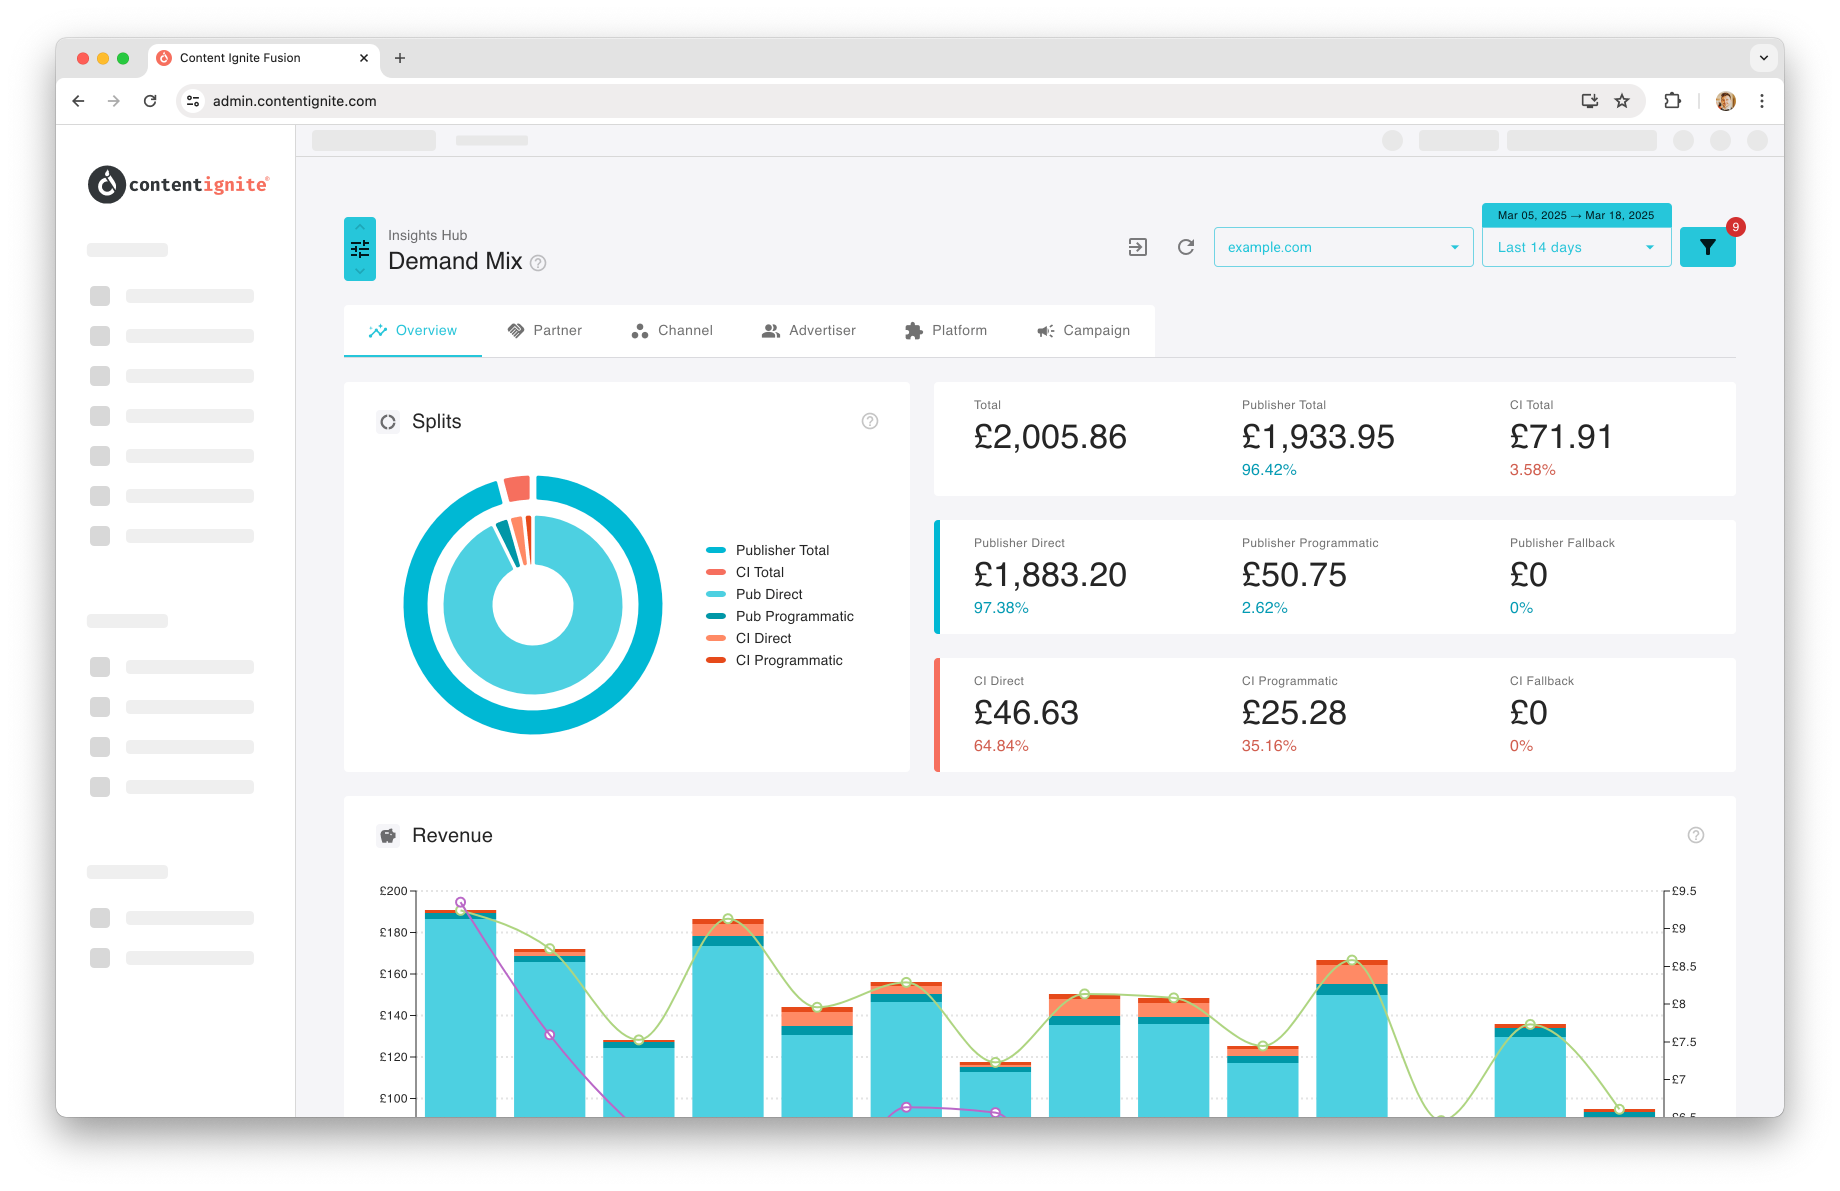
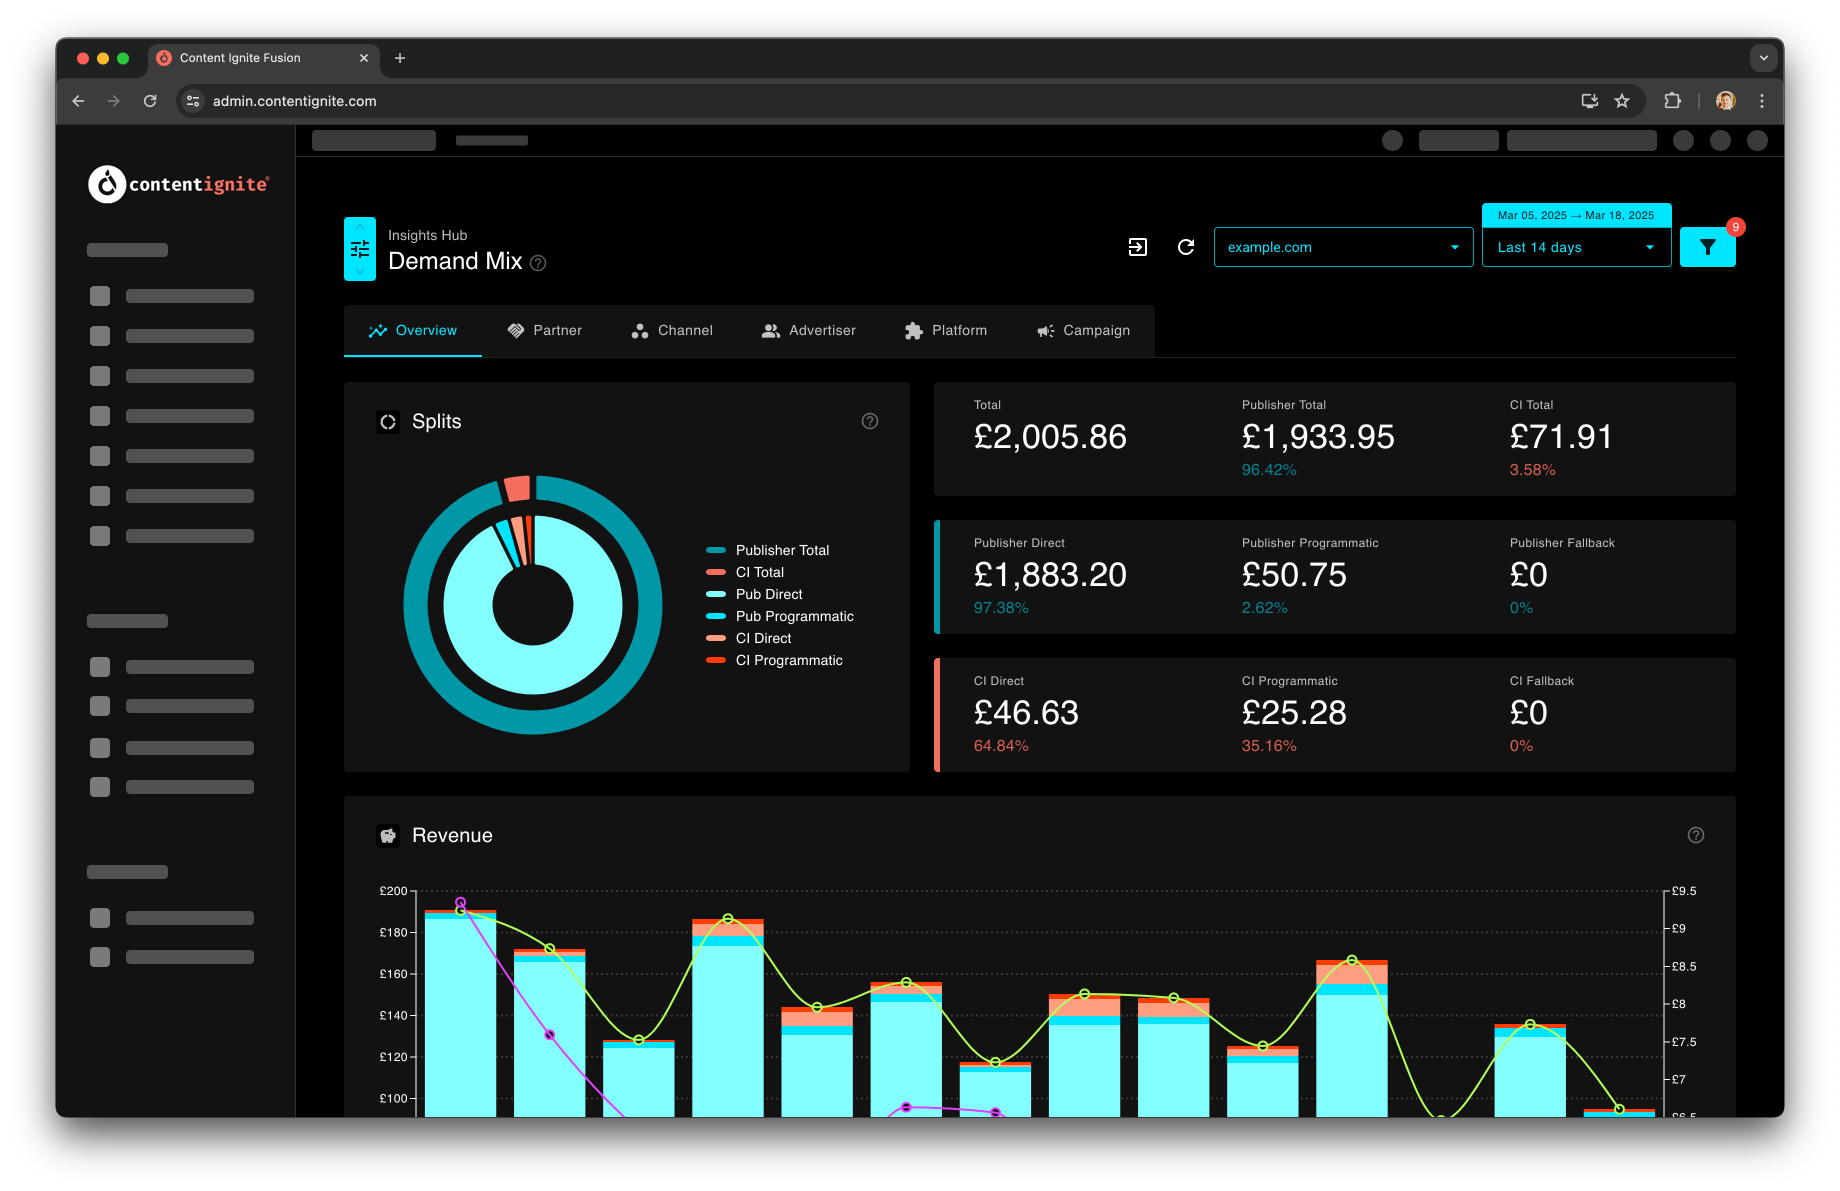
The Overview tab brings together the demand split of your ad setup into a single view. This includes:Splits
Consolidated into a visual breakdown, the Splits section allows you to view the revenue from each of your demand sources, both through a pie chart and detailed breakdowns by revenue and percentage share. The first division breaks demand into either Publisher or Content Ignite, based on the Ad Server setup. In a P&P or Fully Managed setup, most demand will flow through Content Ignite, while in a SaaS setup, demand will lean toward Publisher. This split indicates how your ad setup is configured and may show where Content Ignite is included as a second look. The second-level split breaks down the demand further, showing the proportion of revenue coming through as Direct, Programmatic, or Fallback1. Through the use of colour, we provide a clear visual relationship between these demand sources, which is reflected throughout the various views.Charts
The chart views provide a visual representation of the demand mix splits for Revenue, Impressions, Fill Rate, and Viewability across the different tab views. These charts make it easy to identify performance trends, spot patterns, and compare how each demand source is performing. They also highlight potential opportunities that could arise from increasing demand in specific areas.Dimension Views
Each dimension view — Partner, Channel, Advertiser, and Platform — allow you to break down the demand mix even further, giving you a clear view of which dimensions are out-performing others across the same four metrics. For even more detailed insights, you can filter by a specific dimension to track performance over time on a specific level.Campaigns
The Campaigns tab enables publishers to identify the source of direct campaigns, indicating whether they originated from the Publisher or Content Ignite. It allows you to analyse the spend attributed to each campaign as well as the impressions generated. This insight helps measure the success of campaigns across the two demand sources, providing valuable data for future campaign decisions. A table view further allows you to explore individual campaigns in greater detail.Filter Options
As with other Insights Hub pages, the global filters for Publisher and Date will influence the data being viewed. In addition to these, there are several page-specific filters to further refine the data displayed.Ad Server Grouping
The demand data is split not only by demand type (Direct, Programmatic, Fallback) but also by the demand source (Publisher or Content Ignite). The Ad Server Grouping filter allows you to combine these two sources into a single view, giving you the option to focus on just the demand types without breaking down the data by Publisher or Content Ignite. This is particularly useful when you want a broader, less granular view of your demand distribution, or when comparing how different types of demand are performing across the entire setup.Dimension Filter
For each dimension-specific tab view, a Dimension Filter dropdown lets you select a specific dimension to focus on. This will update the chart to show data split across the selected dimension over the chosen date range, rather than providing a comparison of all dimensions. This feature is useful when you want to track trends for a single dimension over time, helping you identify patterns and changes within a specific area of interest (e.g., a particular partner, channel, or advertiser).Further Fine-tuning
Along with global filters for Date and Publisher that influence the data, Demand Mix Insights offers additional flexibility for data presentation. You can toggle between Gross and Net revenue views, depending on your preference. Graphs can also be adjusted to show totals or percentages, allowing you to analyse performance in different ways. Furthermore, filter exclusions allow you to toggle chart overlay lines, providing more control over how the data is displayed, helping you focus on the most relevant insights.Footnotes
- Unassigned demand will show as an “Untracked” ↩